How much of your profit goes to fees?
Most traders have never added it up. Connect your exchanges: every trade lands in one history, and you see what makes you money and what costs you.
A read-only API key is enough · no withdrawal rights · stored encrypted, delete it any time
- Binance
- Bybit
- OKX
- Bitget
- Hyperliquid
Net P&L+$4,820
Win rate46%
Fees-$1,930
Trades2,418
Weekly net P&Llast 12 weeks · cumulative
By hold time
<5m
5–30m
30m–1h
1–4h
4h+
Fees
Gross profit+$6,750
Paid in fees-$1,930
By session
Asia
London
New York
- Fees took 29% of your gross profit.
- Your winners are the trades you held for 4 hours, not 5 minutes.
- Most of your profit comes from the New York session.
Every level, already on the chart.
TPO, single prints, naked POCs, previous day, week and month: computed for you and drawn live, with CVD and OI under the price.
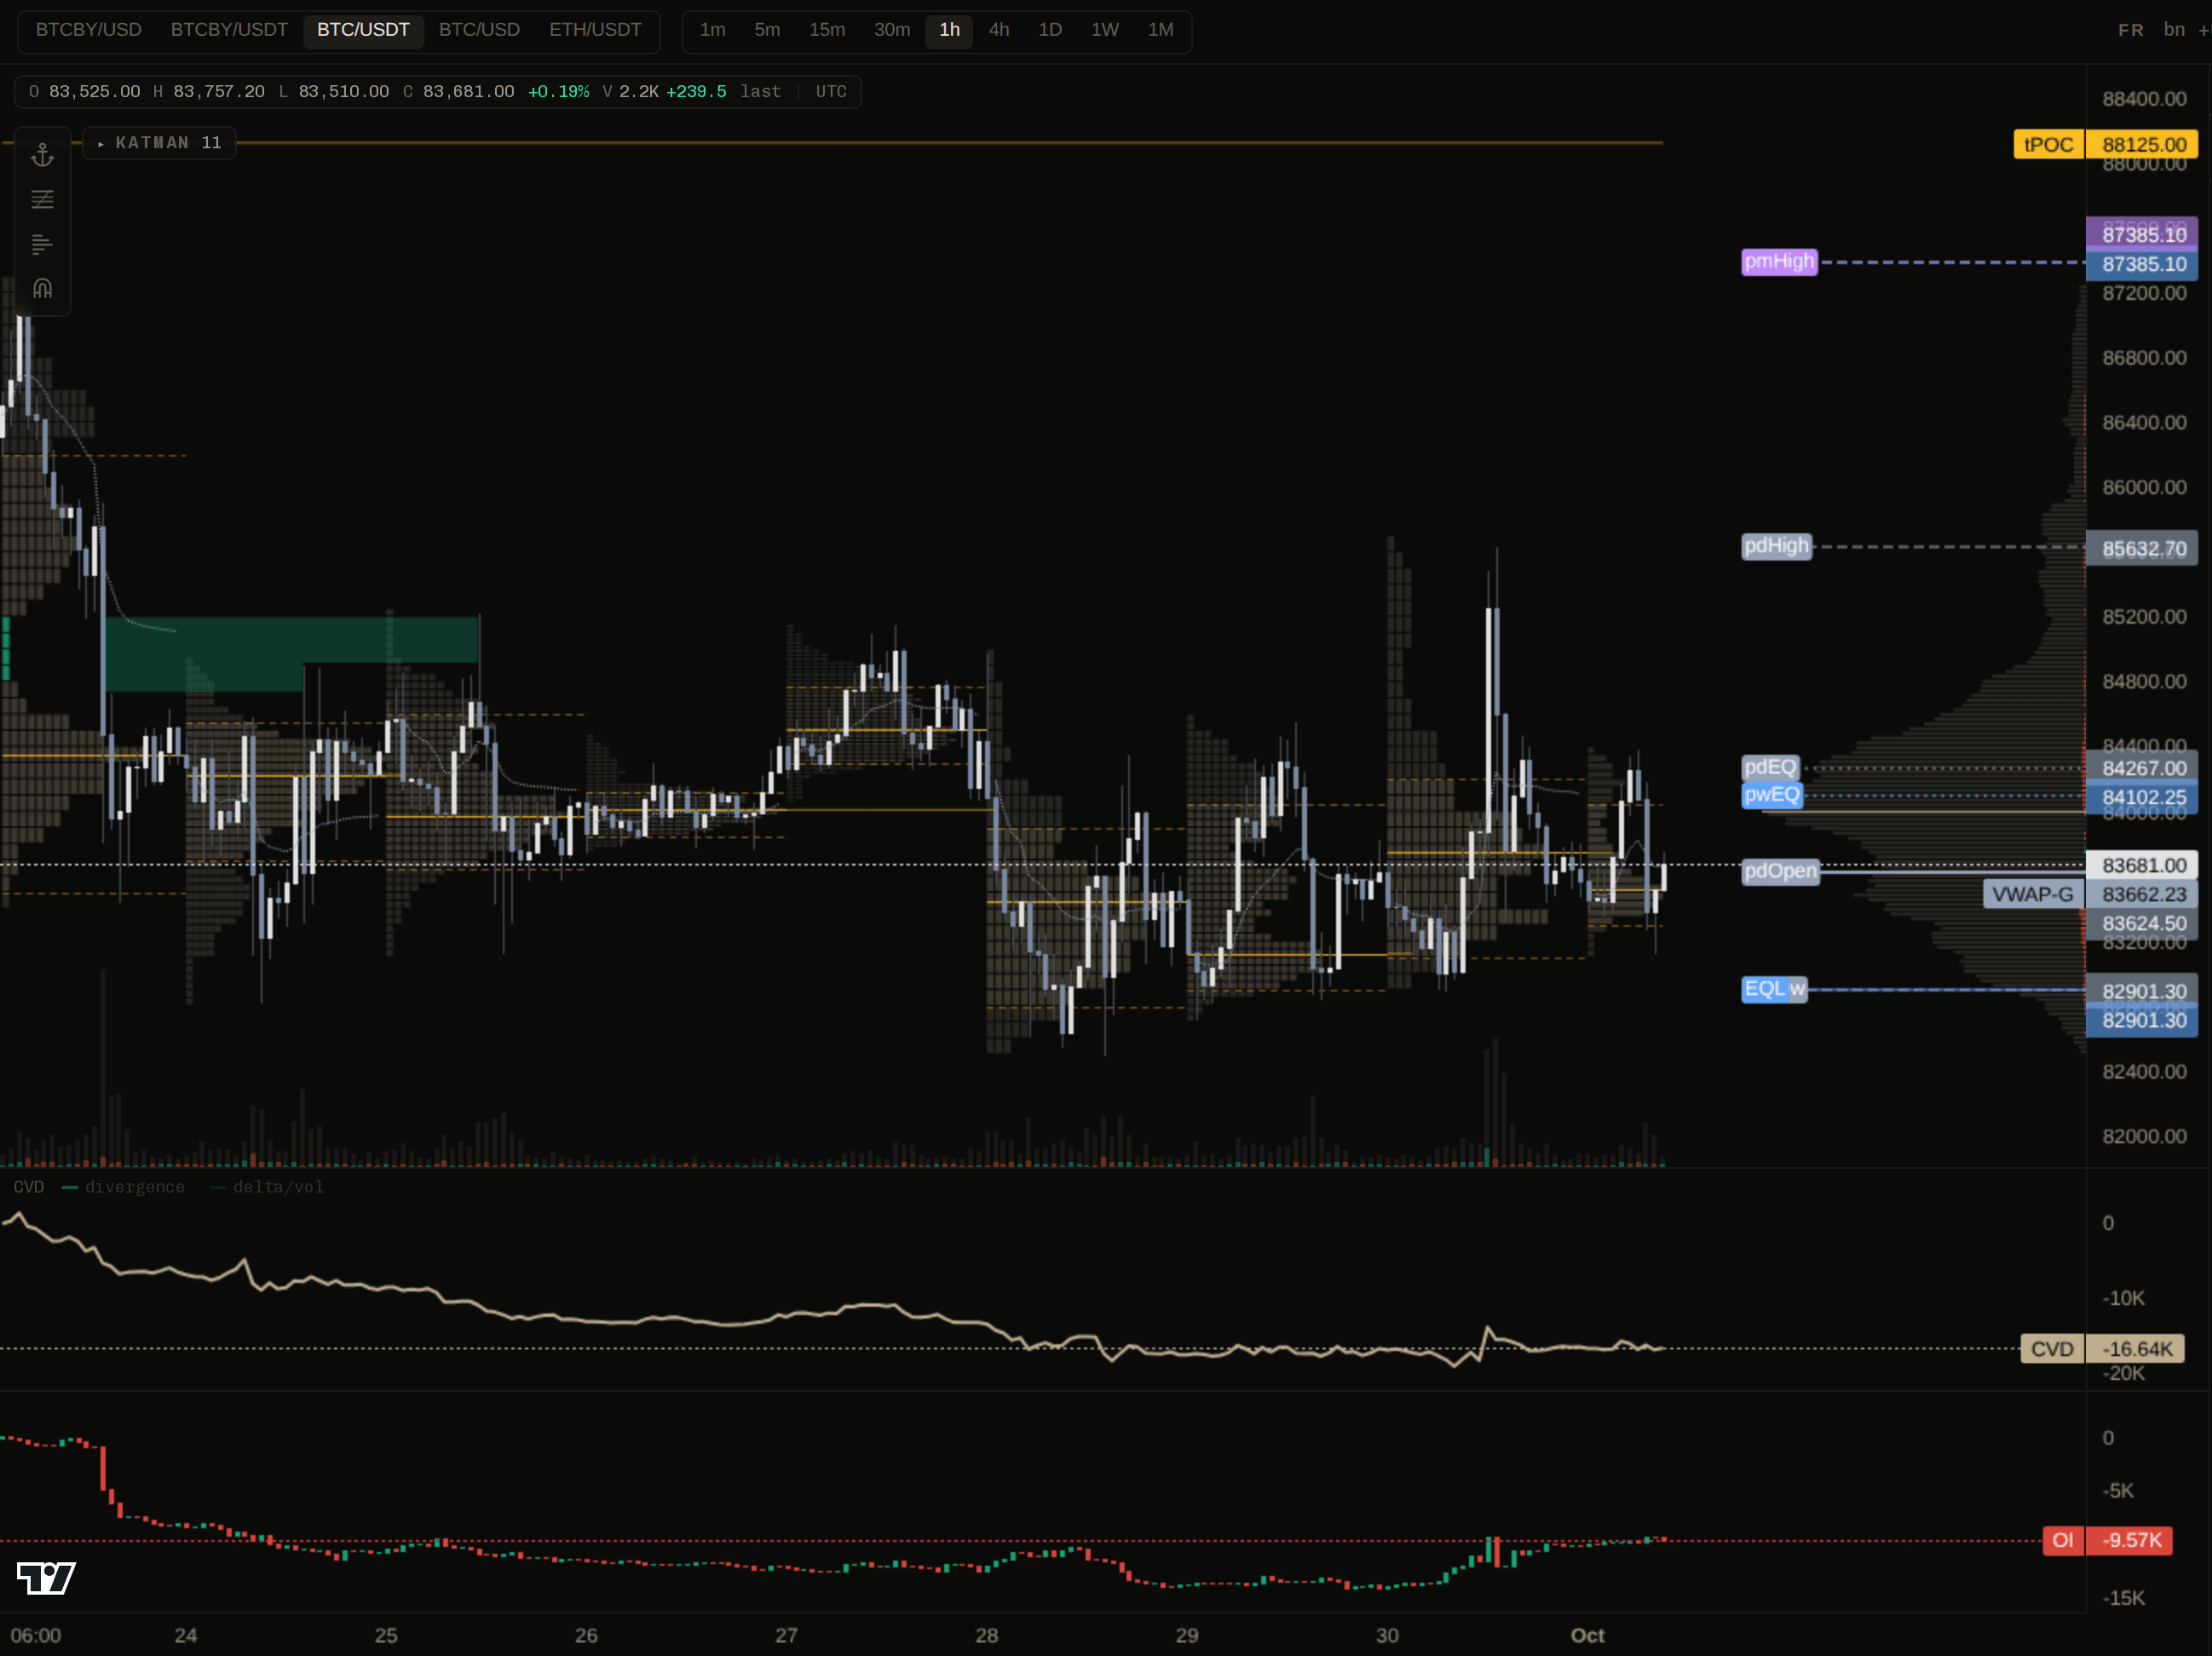
- 1Single printPrices crossed in only one 30-minute period of the day. Bright until price comes back to them.
- 2TPO profileHow long price spent at each level, day by day, with the value area marked.
- 3Naked tPOCA past day's POC that price has not touched yet. It extends right until it is.
- 4Day, week, monthThe open, high, low and midpoint of the previous day, week and month.
- 5Volume profileHow much volume traded at each price across the visible range.
- 6CVD · OIAggressive buying against selling, and open interest, on the same time axis as price.
See your own numbers.
Sign in with Google, add a read-only key, and the report builds itself from your trade history.
A read-only API key is enough · no withdrawal rights · stored encrypted, delete it any time